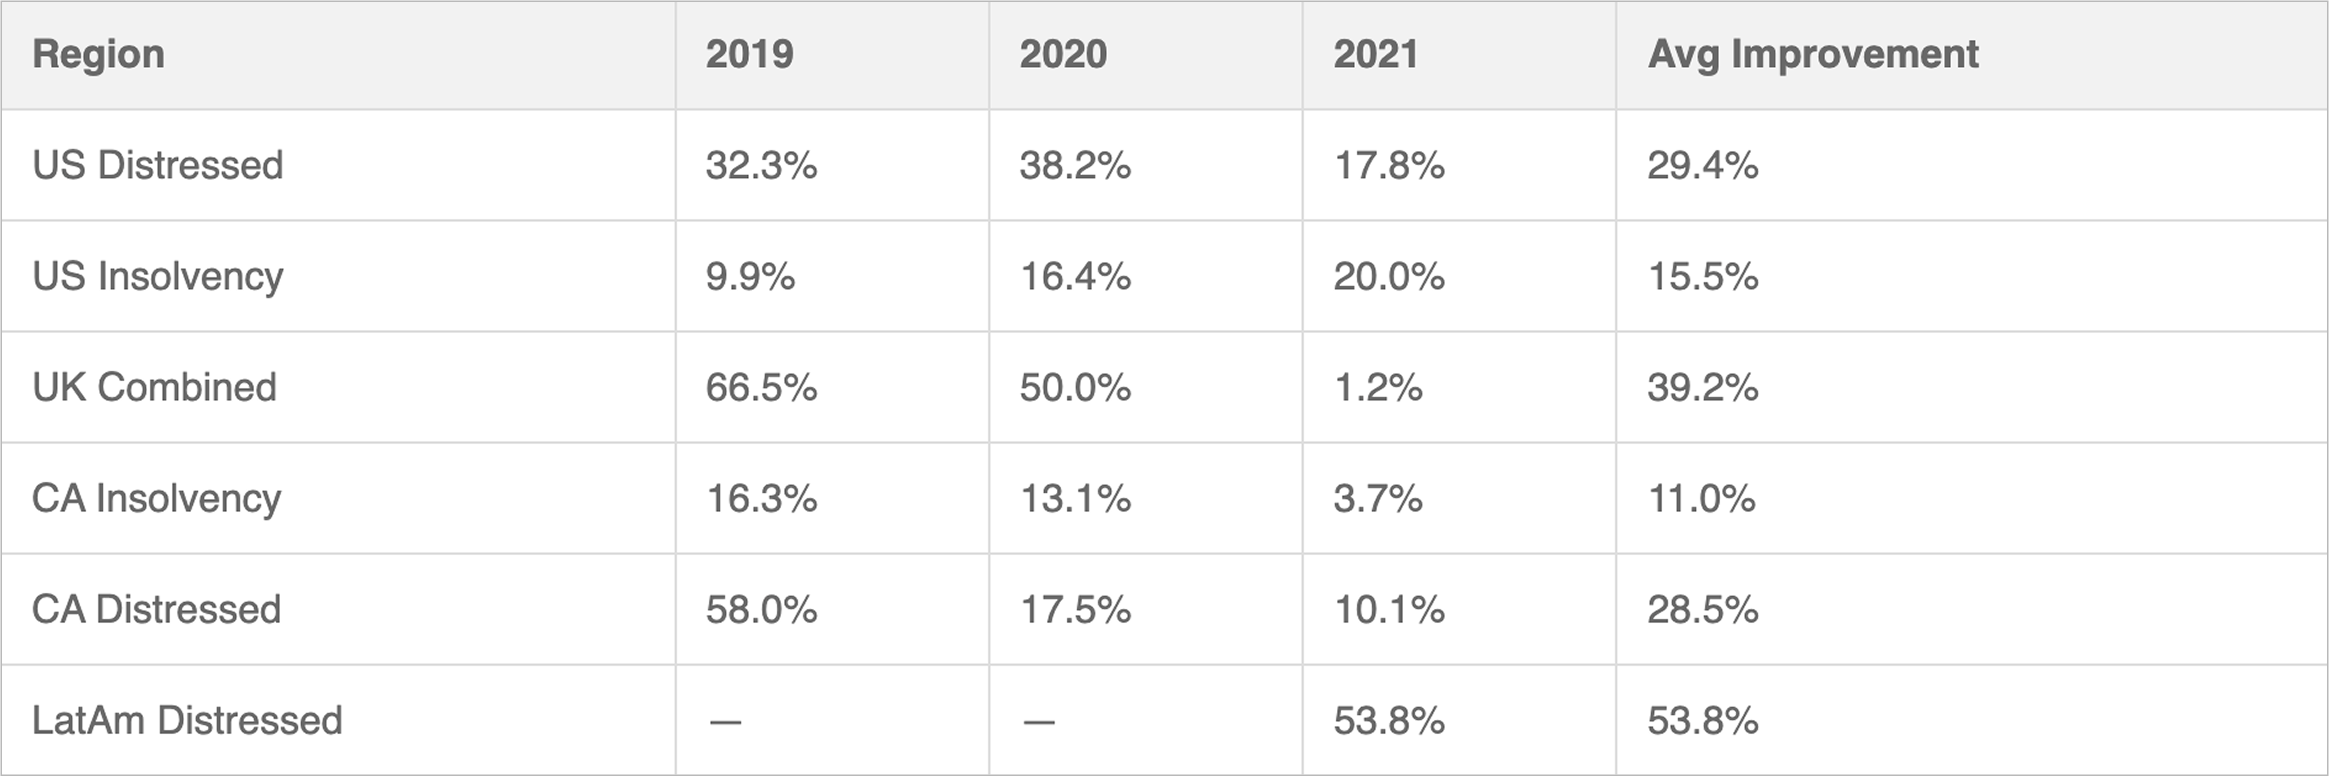
Estimated vs. Actual Collection Multiples in JCAP by region. What the 2019–2021 vintages reveal
Jefferson Capital’s filing gives us a rare, transparent look into how actual collection performance compares to original expectations across geographies and debt types.
Why focus on 2019–2021?
We’ve focused this analysis on the 2019 to 2021 vintages for a specific reason:
Pre-2019 portfolios often suffer from data quality and modeling inconsistencies, as account-level insights, contact enrichment, and segmentation strategies were less advanced.
Post-2021 vintages, on the other hand are still maturing as collections are ongoing, and final performance is not yet stable.
That makes 2019–2021 the most reliable vintage window to assess how well portfolio performance is tracking original expectations in a relatively data-stable and operationally mature context.
Year-by-year comparison
Assuming uniform AI/ML based capacities and optimal operations by JCAP across geographies, we can think of the below observations:
Key observations:
U.S. portfolios, both distressed and insolvency, show solid improvements which indicates accurate pricing, mature modeling, and operational consistency.
UK portfolios delivered surprising upside in 2019–2020 (e.g., +66.5% in 2019), likely driven by favorable pricing and under-penetrated segments. But, those gains collapsed in 2021, possibly due to tighter regulation or increased competition.
Canada, while showing occasional upside, consistently lags the U.S. in performance uplift. One reason is that Canadian collectors often optimize for consumer experience and compliance adherence rather than liquidation rate alone. It's a conscious strategic tradeoff that’s embedded into their recovery culture.
Latin America (2021) stands out as a growth frontier with a 53.8% uplift, driven by low initial purchase pricing and high early-stage collection performance.
{{cta-banner}}
Strategic Takeaway
Original purchase price multiples reflect what was expected, based on pricing models, assumptions, and risk appetite.
But the actuals reveal the operational truth. If the gap is large, positive or negative, it raises critical questions:
Was the pricing too conservative or too aggressive?
Did contact strategies evolve post-purchase?
Are local operating models aligned with liquidation goals?
Smart portfolio operators are constantly asking:
“How well did we forecast? And what helped or hurt our realization curve?”
Because in debt recovery, underwriting is just the beginning, execution is the differentiator.
{{cta-banner}}
Collections
Compliance and QA
Forecasts only work when your strategy does too
Use ProCollect to drive higher liquidation with AI-powered outreach, smart segmentation, and omnichannel execution.


.webp)


.jpg)
.jpg)


.jpg)


.webp)
.webp)


.webp)


-min.avif)


.avif)


-modified.avif)


.avif)


