Recent lender earnings results in late 2025 illustrate an important, but often under-examined, operating dynamic in unsecured credit portfolios:
Collections performance remains tightly coupled to human-capacity models, creating rising marginal costs and declining operational leverage as delinquency volumes fluctuate.
While individual companies face distinct customer profiles, risk appetites, and credit strategies, three recent datapoints have renewed industry discussion about collections scalability and cost structure:
- Capital One reported 22% year-over-year growth in operating expenses in Q3 2025
- Bread Financial published a 7.5% net loss rate for October
- OneMain Financial reported 6.67% net charge-offs
Market observers attribute these trends to several factors, including normalization from post-stimulus baselines, macroeconomic pressure on household liquidity, and credit risk concentration in non-prime borrowers.
However, an additional operational lens is emerging: the linear relationship between delinquency volume and human collections headcount may be limiting the efficiency frontier for many lenders.
We call this dynamic the Linear Trap.
Can we solve delinquency with headcount?
For more than two decades, collections performance has largely followed a capacity-driven model:
If delinquency volume increases, workforce capacity must increase proportionally.
This model has been pragmatic and effective in environments where labor pools were accessible, portfolio growth was moderate, and delinquency volatility remained within planning tolerances.
Today, several structural shifts are placing pressure on that model:
| Structural driver |
Typical industry observation |
| Rising labor and onboarding cost |
Higher wage inflation, longer ramp time, and growing compliance training requirements. |
| Higher variability in delinquency patterns |
Volatile macro signals and uneven borrower stress drive spikes in delinquency. |
| Greater compliance documentation burden |
More disclosures and audit trails reduce net talk time and add overhead. |
| Limited agent throughput |
Daily dials plateau despite incentives or tooling, creating a throughput ceiling. |
As a result, incremental productivity gains are increasingly difficult to achieve through traditional staffing alone.
Why can’t human collection teams scale efficiently anymore?
Even among highly trained collectors, daily call volumes follow consistent productivity patterns.
Typical full-time capacity profile:
| Component |
Estimated minutes |
| Total shift time |
480 minutes (8 hours) |
| Breaks & micro-breaks |
60–70 minutes |
| Wrap, notes & admin |
80–120 minutes |
| Compliance activities |
Variable but rising |
| Net talk & dial time |
~230–260 minutes |
This generally translates to ~120–150 outbound dials per agent per day depending on contact strategy, portfolio type, and compliance requirements.
Productivity improvements are certainly possible (better segmentation, right-time dialing, omnichannel coordination), but even high-performing teams remain bound by time, sequencing and cognitive workload.
When delinquency > capacity, organizations face decisions such as:
- Add headcount
- Prioritize high-value accounts
- Extend dial windows / overtime
- Outsource, augment, or defer outreach
Each option carries financial and operational tradeoffs. This is the core mechanism behind the Linear Trap.
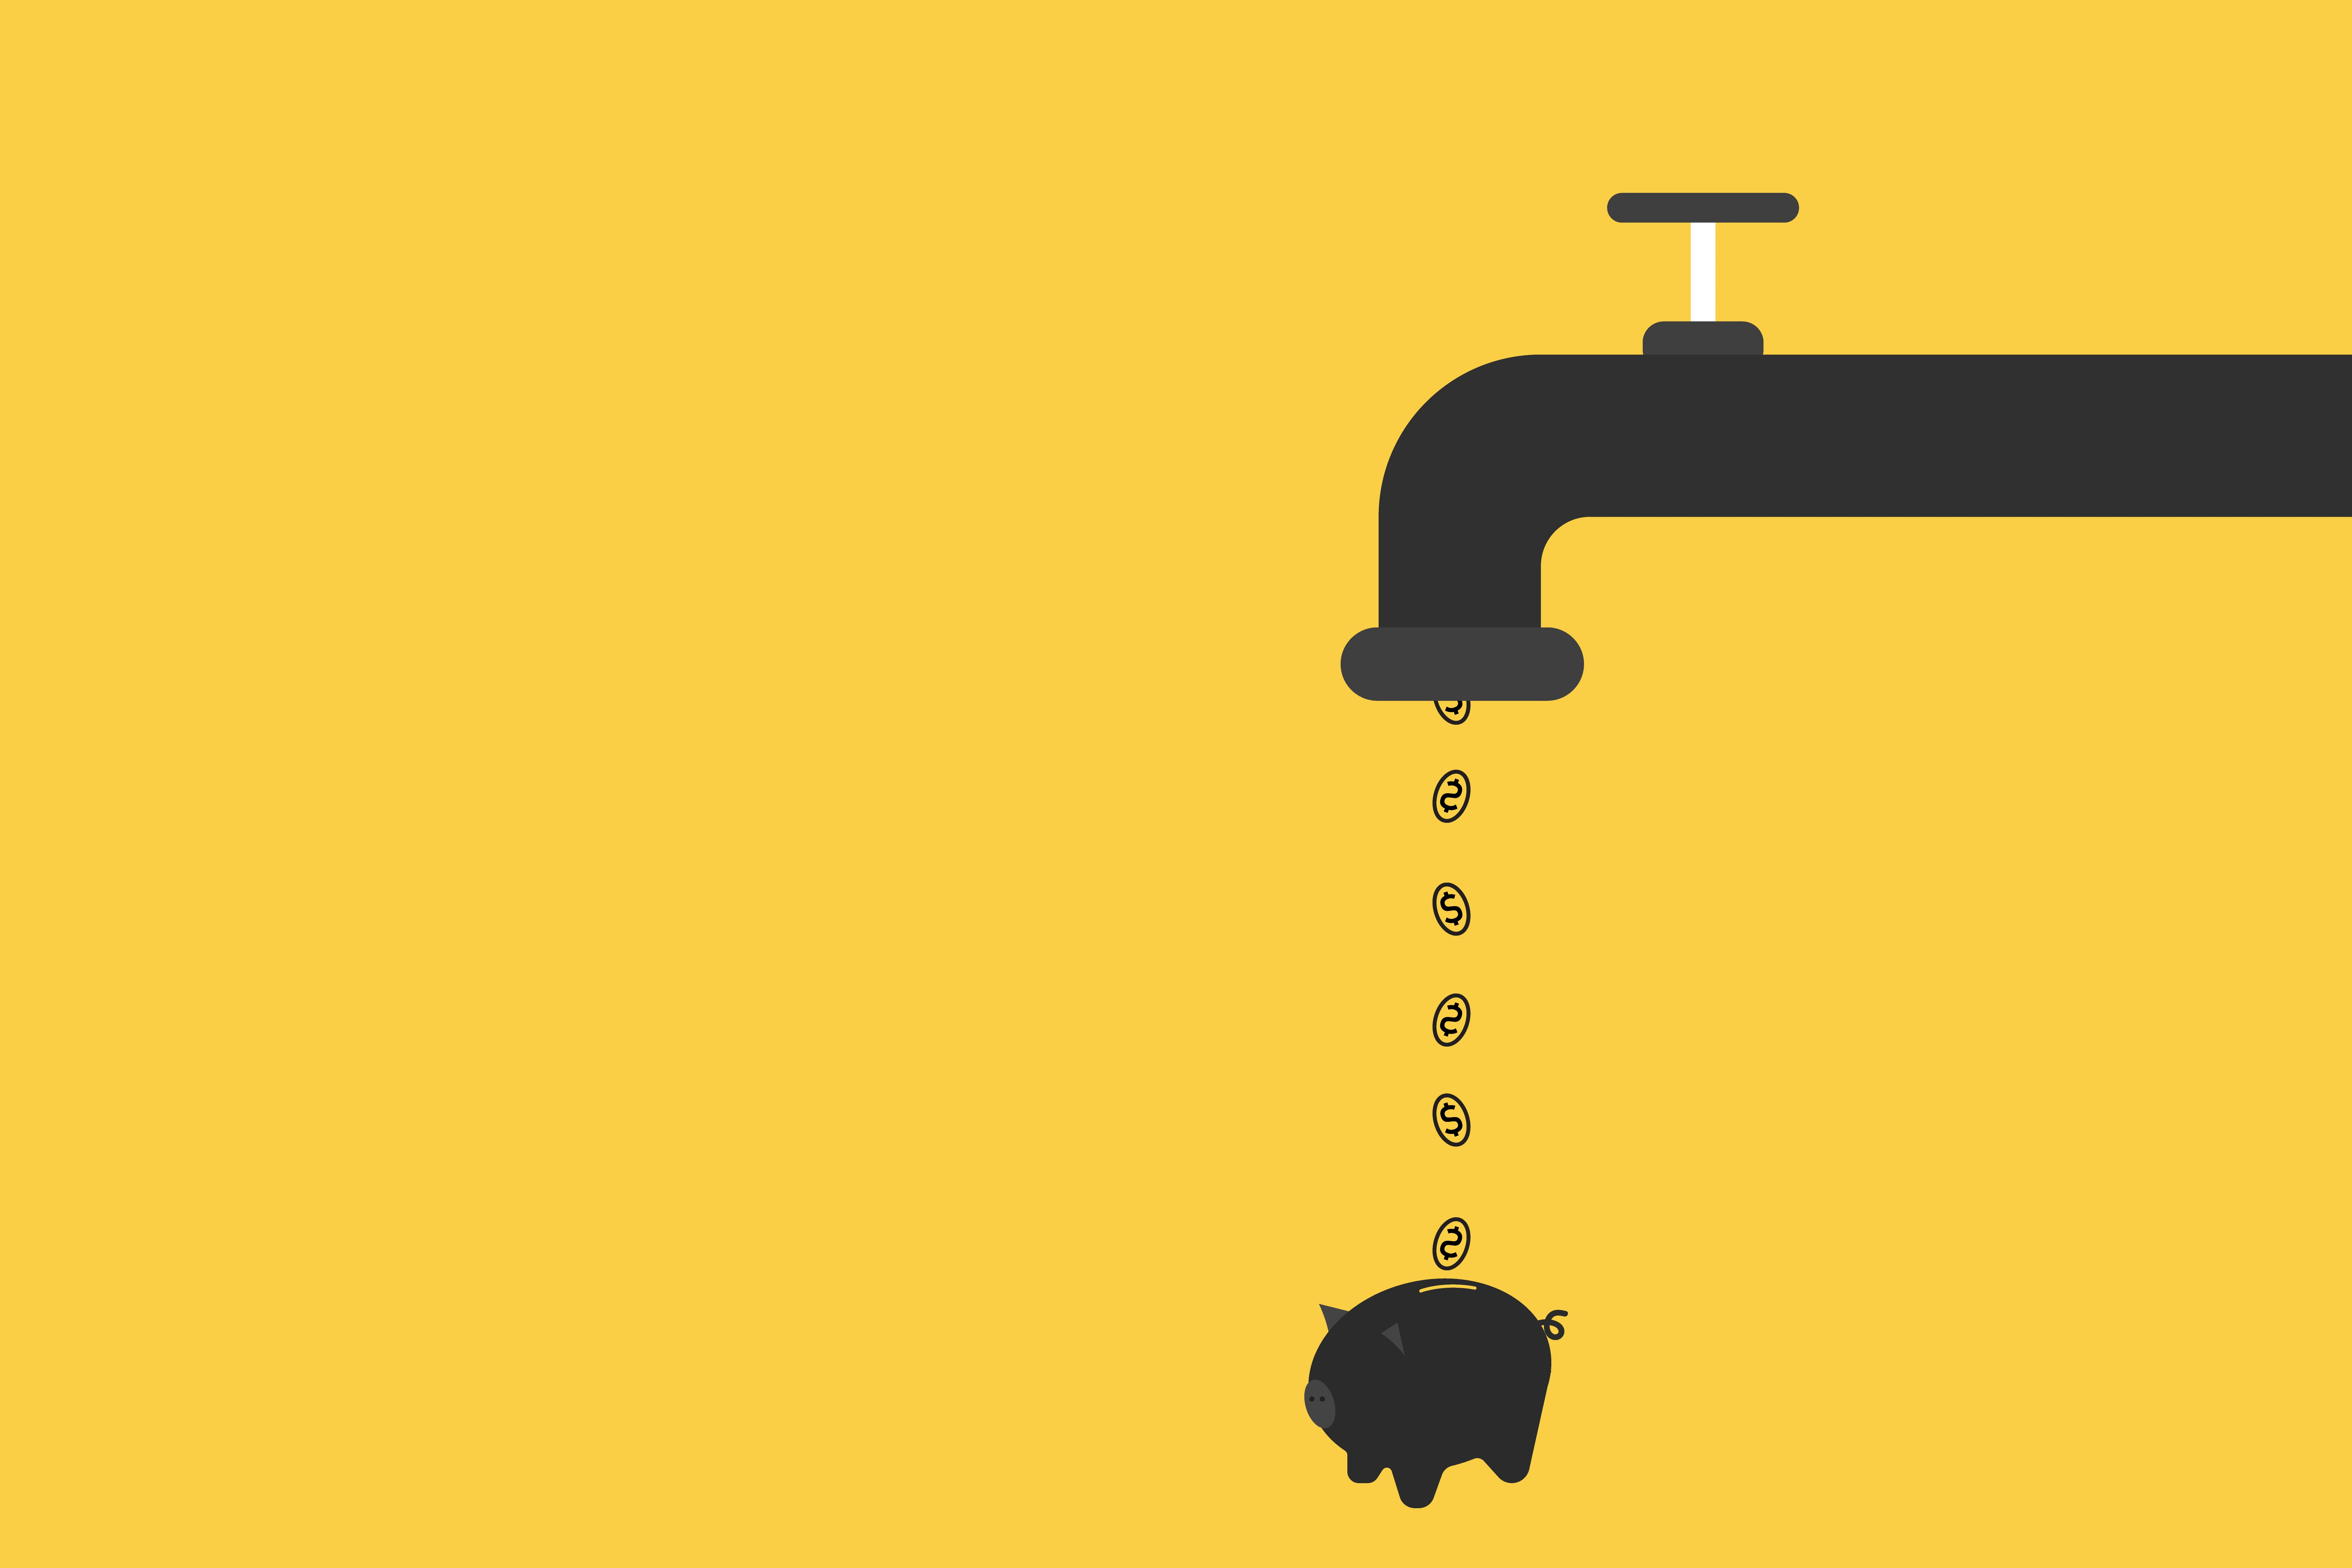
What is the financial impact of unworked delinquent accounts?
When operational capacity becomes constrained, lower-balance or lower-probability accounts may receive reduced or no outreach.
Executives informally describe a “mental threshold” - the balance level at which the expected unit recovery falls below the expected unit cost of outreach.
For some lenders this may occur at $150–$500, depending on portfolio strategy, cost structure, vendor contracts, and settlement policies.
This can lead to the formation of what operational leaders sometimes call an Unworked List: accounts that are eligible but not economically prioritized for active outbound engagement.
When aggregated across large portfolios, this can represent meaningful potential revenue not fully explored, particularly 60–90 day delinquency buckets, where some cure potential still exists but capacity constraints shape prioritization.
While not universal and highly dependent on risk appetite, some portfolios report 25–40% of accounts falling below prioritization thresholds during peak cycles.
{{cta-banner}}
How AI Agents transform lending economics
To address the limitations of linear scalability, lenders are increasingly evaluating technology-enabled operating models, including the use of AI-enhanced digital and voice agents that can run concurrent outreach at high volume and low marginal cost.
AI agents differ from traditional automation in that they can:
- scale concurrency (multiple simultaneous conversations)
- operate continuously (after-hours and weekends)
- reduce marginal cost per contact
- work smaller-balance accounts economically
- standardize compliance behaviors
Illustrative comparison:
| Metric |
Human agent |
AI agent |
| Max daily conversations |
120–150 |
5,000–100,000+ concurrent calls |
| Cost structure |
Fixed salary + incentives + overhead |
Primarily variable; low marginal cost per call |
| Hours of operation |
Business hours |
24×7 |
| Consistency & compliance |
Subject to fatigue and variance |
Centralized and standardized by design |
| Small-balance viability |
Often uneconomic under $150–$500 |
Economical even for micro-balances |
While results vary by implementation maturity, companies exploring AI-augmented collections report interest in potential benefits such as coverage expansion, reduction in unworked segments, cost rebalancing, and improved agent allocation toward complex cases.
Strategic questions for 2026 planning cycles
Executives preparing 2026 operating models may consider the following diagnostic questions:
- What percentage of delinquent accounts receive no outreach due to capacity economics?
- What are the fully loaded labor unit costs per successful right-party contact (RPC)?
- Which delinquency buckets show the highest delta between cost-to-collect and cure probability?
- What proportion of collector time is spent on complex negotiation vs. routine communication?
- Where can AI-assisted outreach extend coverage without introducing compliance risk?
- What is the breakeven economics of outreach on <$300 balance accounts under different labor + tech models?
Conclusion
The recent financial disclosures from several major lenders highlight not only credit risk dynamics but also operational leverage considerations.
As delinquency patterns evolve and customer behavior becomes more heterogeneous, collections organizations may benefit from reassessing capacity models, cost curves, and digital-to-human workflow design.
The transition is not binary: the emerging model is hybrid, retaining human expertise for complex, emotionally sensitive, or legal-path accounts, while leveraging digital and AI capacity to extend coverage and introduce scale economics where feasible.


.jpg)
.jpg)


.webp)
.webp)


.webp)


-min.avif)


.avif)


-modified.avif)


.avif)


.avif)


.avif)


